Home>Weather and Climate>How to Read a Climograph: A Beginner’s Guide
Weather and Climate
How to Read a Climograph: A Beginner’s Guide
Published: June 9, 2024
Learn how to interpret and analyze climographs with this comprehensive guide. Understand the relationship between weather and climate.
(Many of the links in this article redirect to a specific reviewed product. Your purchase of these products through affiliate links helps to generate commission for Temperatures.com, at no extra cost. Learn more)
So, let's dive into the world of climographs, shall we? Picture these as snapshots capturing the essence of weather patterns over time. They're like the DNA of a place's climate, showing us temperature and precipitation trends. Now, interpreting these graphs isn't rocket science, but it does require a bit of know-how.
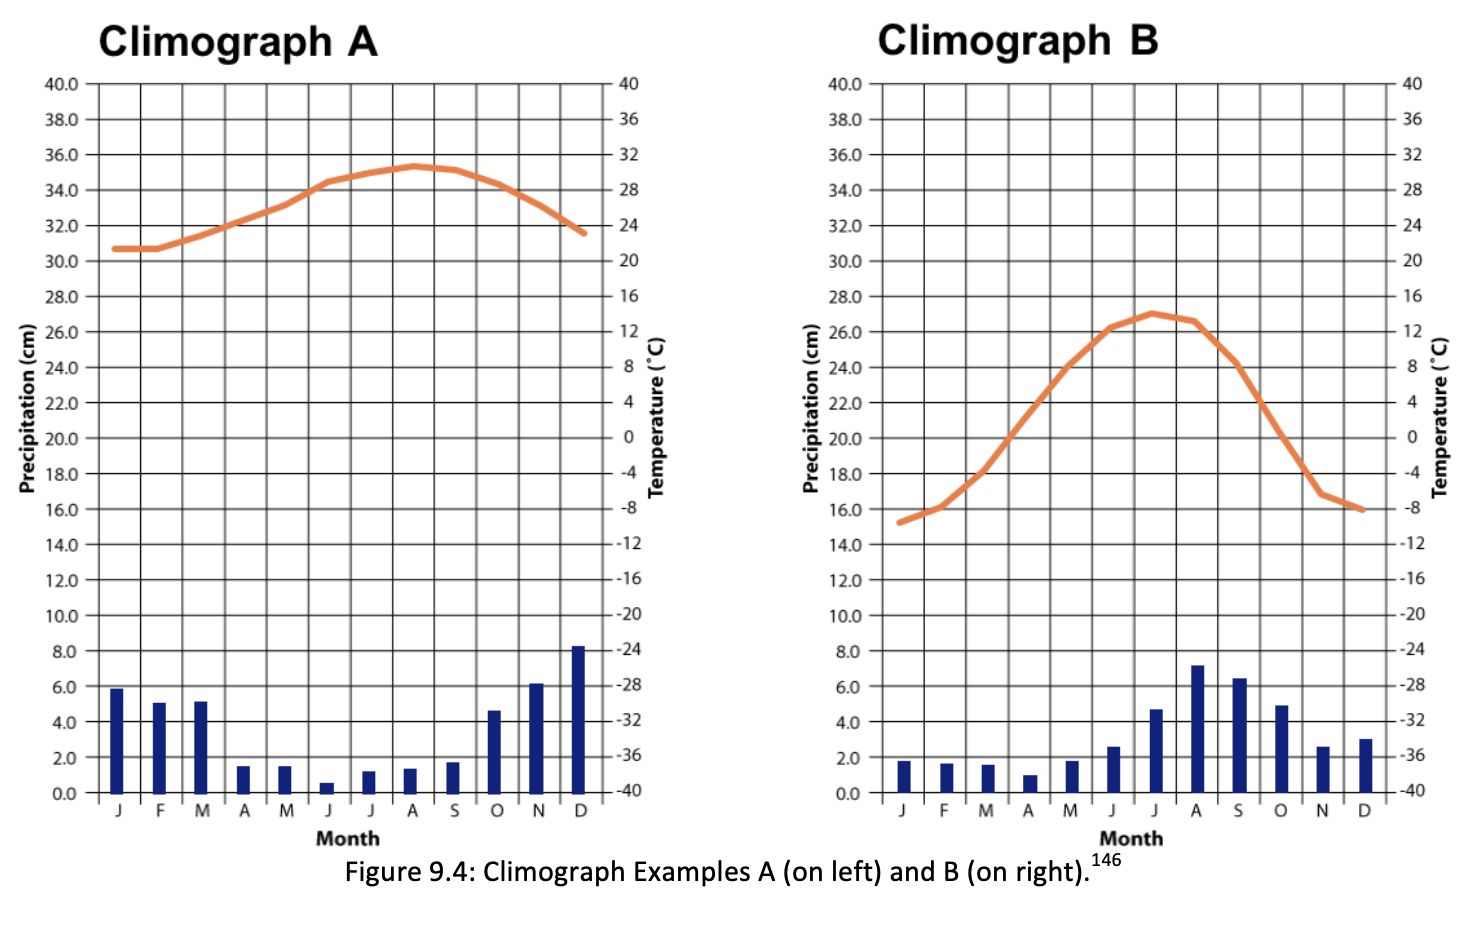
First off, you've got your temperature line, usually in red or another warm color, because, well, heat. This line zigzags across the graph, showing highs and lows throughout the year. Then, there's the precipitation bar, often in blue, giving us the lowdown on rain, snow, you name it, across different months.
Here's where it gets interesting. By looking at how these two dance together on the graph, you can tell a lot about a place. A tight, consistent temperature line with low precipitation? You're likely looking at a desert. Big, bold precipitation bars with a mild temperature line? Hello, tropical paradise.
So, next time you're planning a trip or just nerding out over climates, give those climographs a glance. They tell an intriguing story about what makes each corner of our planet unique. Trust me, it's a skill that's as cool as it sounds.