Home>Weather and Climate>How Record Temperatures in Boston Impact Daily Life

Weather and Climate
How Record Temperatures in Boston Impact Daily Life
Published: September 4, 2024
Explore Boston's historical temperature records and learn about the city's weather and climate trends. Discover how weather patterns have shaped Boston's climate over the years.
(Many of the links in this article redirect to a specific reviewed product. Your purchase of these products through affiliate links helps to generate commission for Temperatures.com, at no extra cost. Learn more)
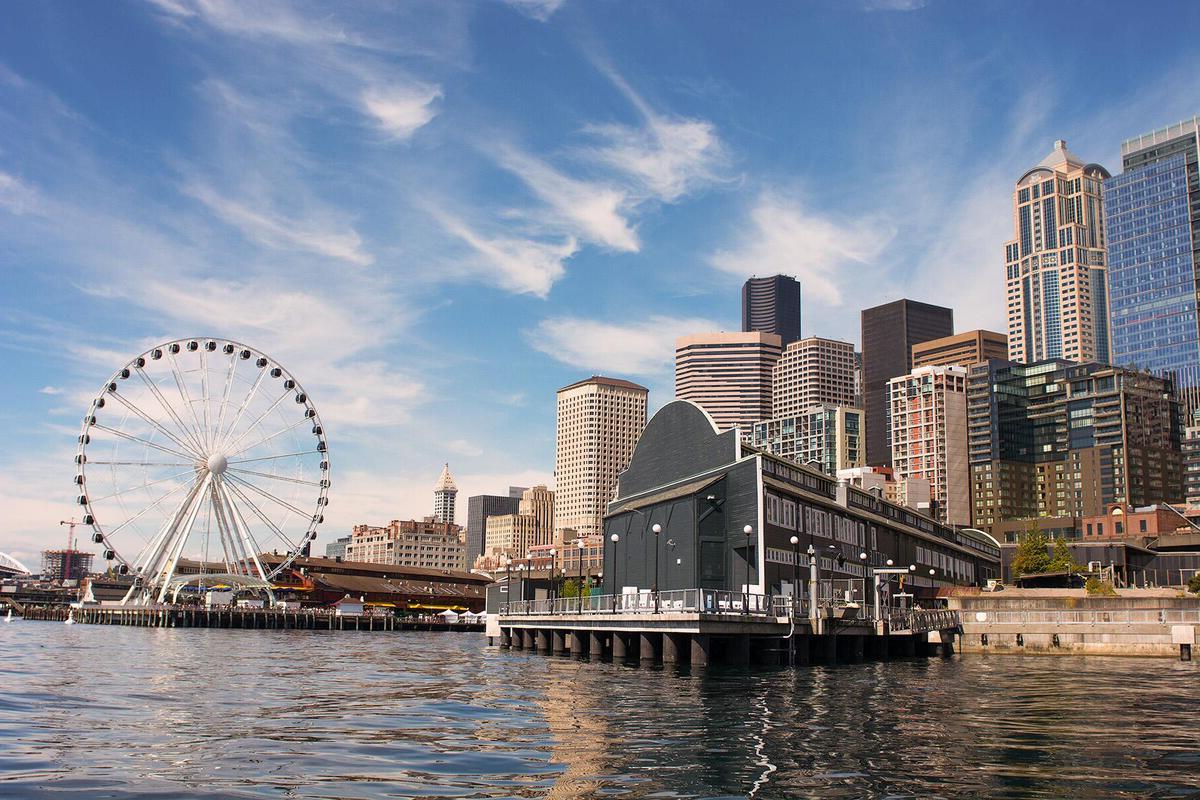
I've always been fascinated by how weather patterns paint stories across time and space. Boston, with its rich history, isn't just a hub for American lore but also a canvas for some intriguing meteorological records. Diving into the archives, I found that Boston's temperature tales are as varied as its seasons.
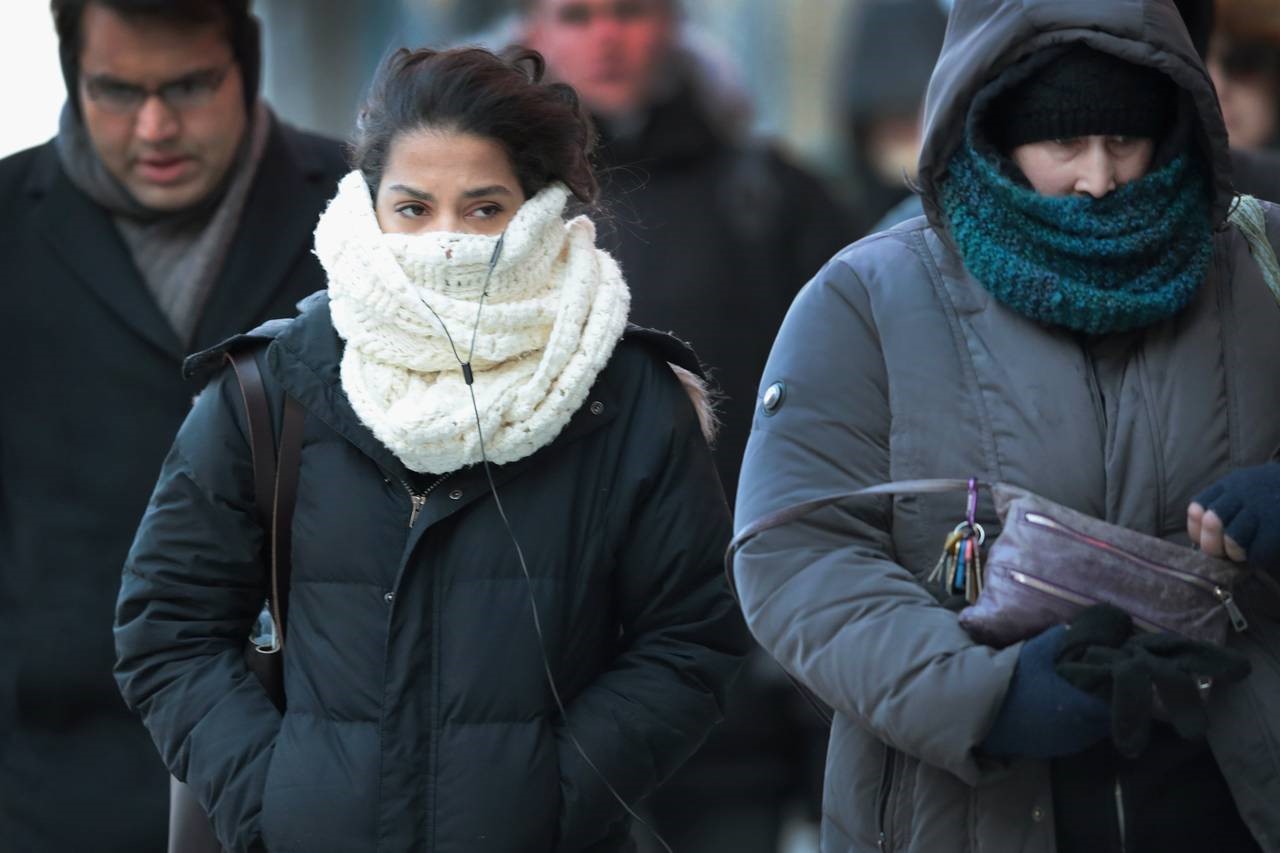
One record that stands out is the coldest day ever recorded. Picture this: February 9, 1934. The city was practically frozen over, with temperatures plummeting to a bone-chilling -18°F. Imagine the Charles River, solid enough for a brisk walk from Cambridge to Boston without a bridge in sight.
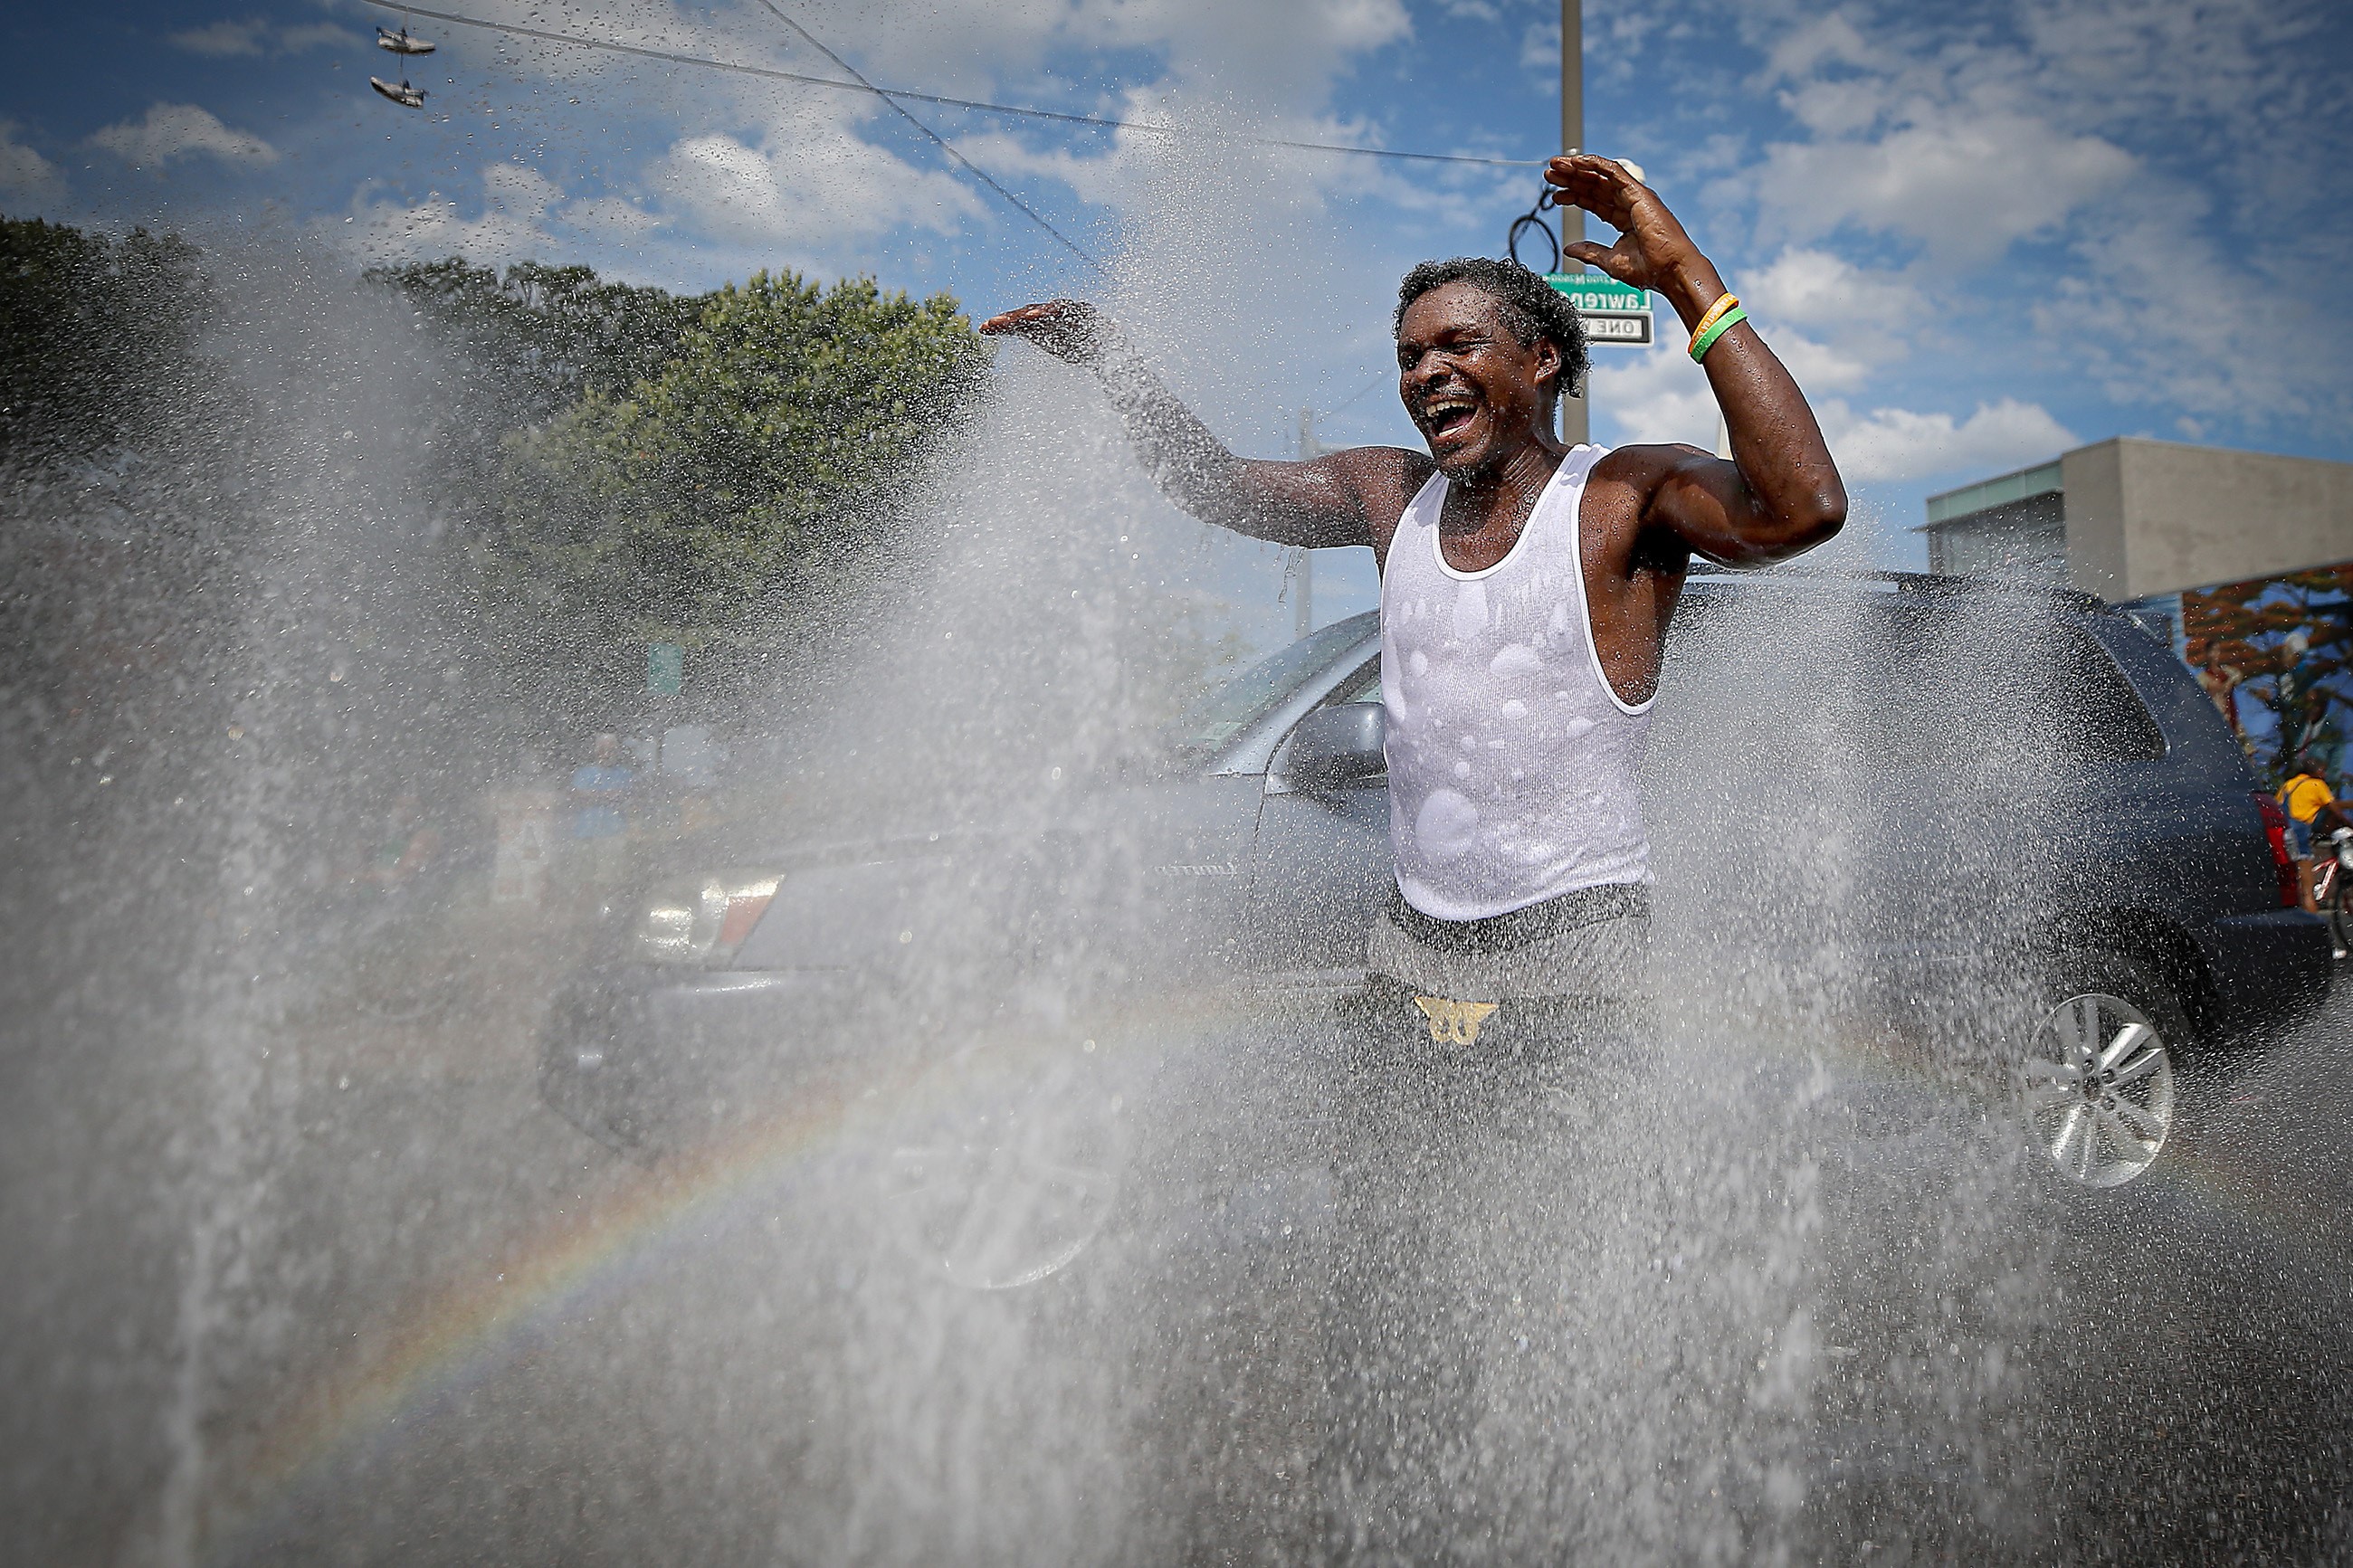
On the flip side, Bostonians have also experienced sweltering heat. The hottest day on record hit 104°F on July 22, 2011. Streets felt like saunas, and the air was thick enough to slice. Locals sought refuge anywhere with air conditioning, turning the city into a ghost town under the scorching sun.
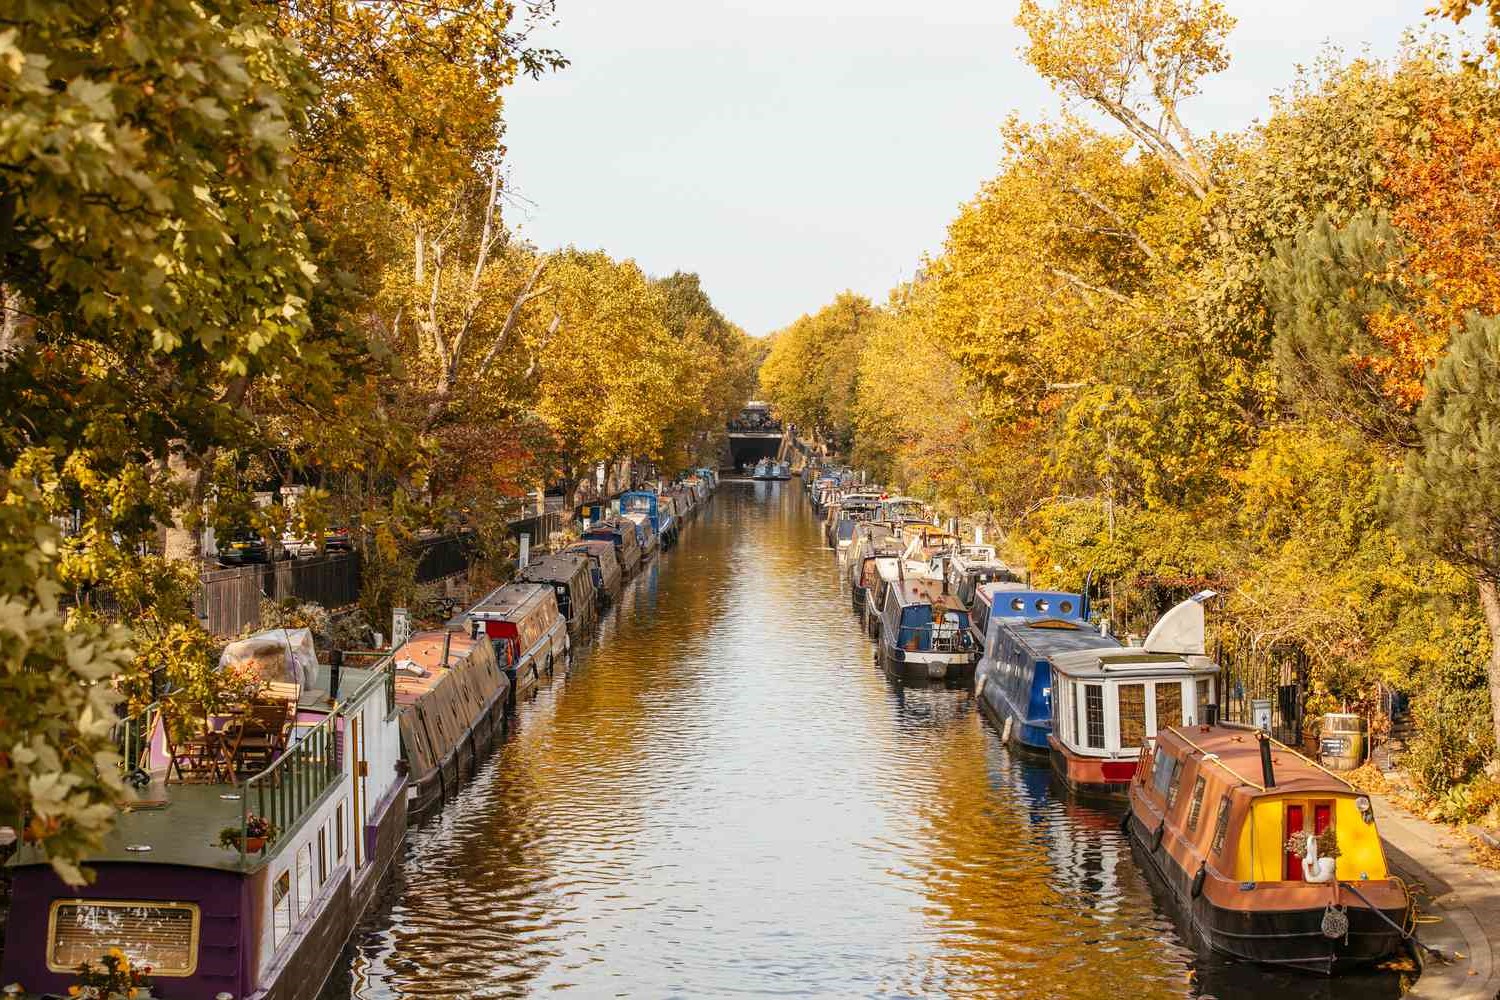
Seasonal extremes aside, Boston's weather has been a rollercoaster. From snowy winters that blanket the city in serene white to crisp autumns that paint the town in hues of amber and gold, each season tells its own story. These historical temperature records aren't just numbers; they're chapters in Boston's ongoing tale, each adding depth to its vibrant narrative.